
作者:Yanli Liu
编译:活水智能
特别说明:本文略有删减
2024年上半年已经过去,我决定整理自己的财务状况,减少不必要的开支,并制定更好的理财计划。然而,直接使用像ChatGPT这样的在线工具可能会泄露我的个人财务数据,为了保护隐私,我创建了一个可以在本地运行的AI财务分析助手。
这个助手完全在本地运行,无需网络连接,且完全免费。它能够导入我的财务数据,分析我的收入和支出,并根据我的生活目标提供个性化的财务规划建议。
接下来,我将详细演示如何从零开始搭建这个本地AI财务助手。
免责声明:本文仅用于学习目的,不构成任何个人财务或投资建议。所有观点仅代表作者个人。
整体介绍
目标与架构
该应用程序使用Streamlit构建用户界面,核心部分采用了LangChain和Ollama中的本地开源大模型。在这个项目中,我使用了Mistral和LLAVA等先进的开源大模型,以实现多模态功能。
通过精心设计的提示词,我将大模型设置为一个“专业财务规划师”,可以为个人提供财务建议。项目的目标包括:
- 处理和分类财务数据
- 分析总收入、支出和节余,并可视化这些数据的变化趋势
- 利用多模态功能理解图表,发现财务变化规律
- 根据我的生活方式,生成个性化的投资建议
(注:本文需要一定的编程基础。已参加过AI线下工作坊二期的同学,可以使用我们提供的方法,操作更流畅。)
所需工具
- Ollama:一个简单易用的工具,用于运行开源大模型,支持Llama 2、Mistral、LLAVA等模型。Ollama可以在MacOS、Windows和Linux系统上安装。
- LangChain:一个用于构建AI应用程序的开源框架,简化了大模型的集成和开发,并与Ollama中的开源模型很好地兼容。
- Streamlit:一个开源框架,允许开发者使用少量Python代码快速创建和共享数据驱动的Web应用程序,非常适合快速原型设计和开发复杂的数据仪表盘项目。
Step 1:安装应用和准备财务数据
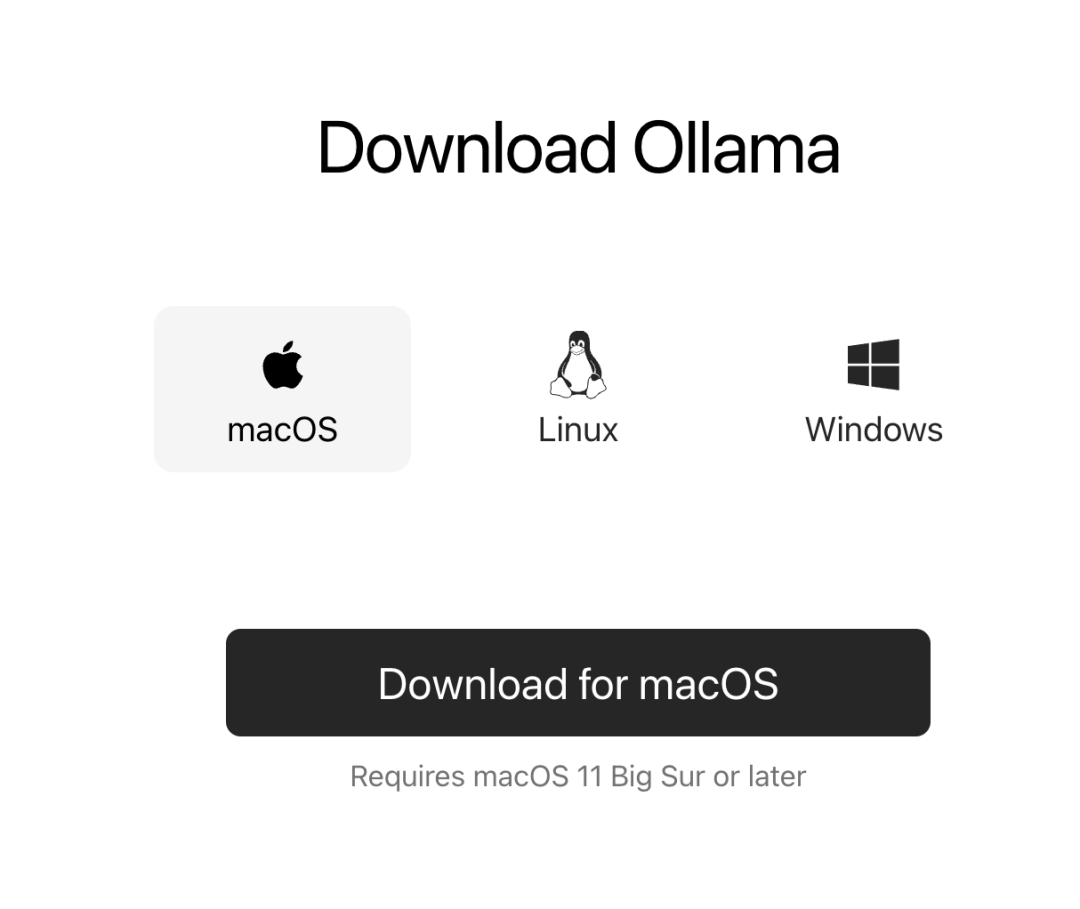
安装Ollama
访问Ollama的下载页面,选择与你的操作系统匹配的版本,下载并安装。
安装完成后,打开终端(Mac用户搜索终端,Windows用户搜索cmd),并输入以下命令以下载所需的开源大模型。在本项目中,我们将使用Mistral和LLAVA。
ollama serve
ollama pull mistral
ollama pull llava
ollama run mistral
ollama run llava
准备数据集
为了演示,我使用了合成数据代替我的个人财务数据。你也可以使用自己的真实财务数据。以下是生成测试数据的提示词:
生成一个年轻金融专业人士在欧洲生活的财务数据集,涵盖2022年1月至2023年12月的1000笔财务数据。确保收入和支出在各个类别中均衡分布。数据集应包括以下四列:日期:财务数据日期(格式:YYYY-MM-DD);名称/描述:每笔财务数据的独特详细描述(例如:"工资存款","每月房租支付","与朋友的餐馆晚餐");支出/收入:明确标明财务数据是支出(例如:"支出")还是收入(例如:"收入");金额(欧元):财务数据金额(单位:欧元)。
生成的数据集应包括以下四列:
- 日期:财务数据日期
- 名称/描述:财务数据的简短描述,用于大模型根据财务数据性质进行分类
- 支出/收入:标明是收入还是支出
- 金额(欧元):财务数据金额
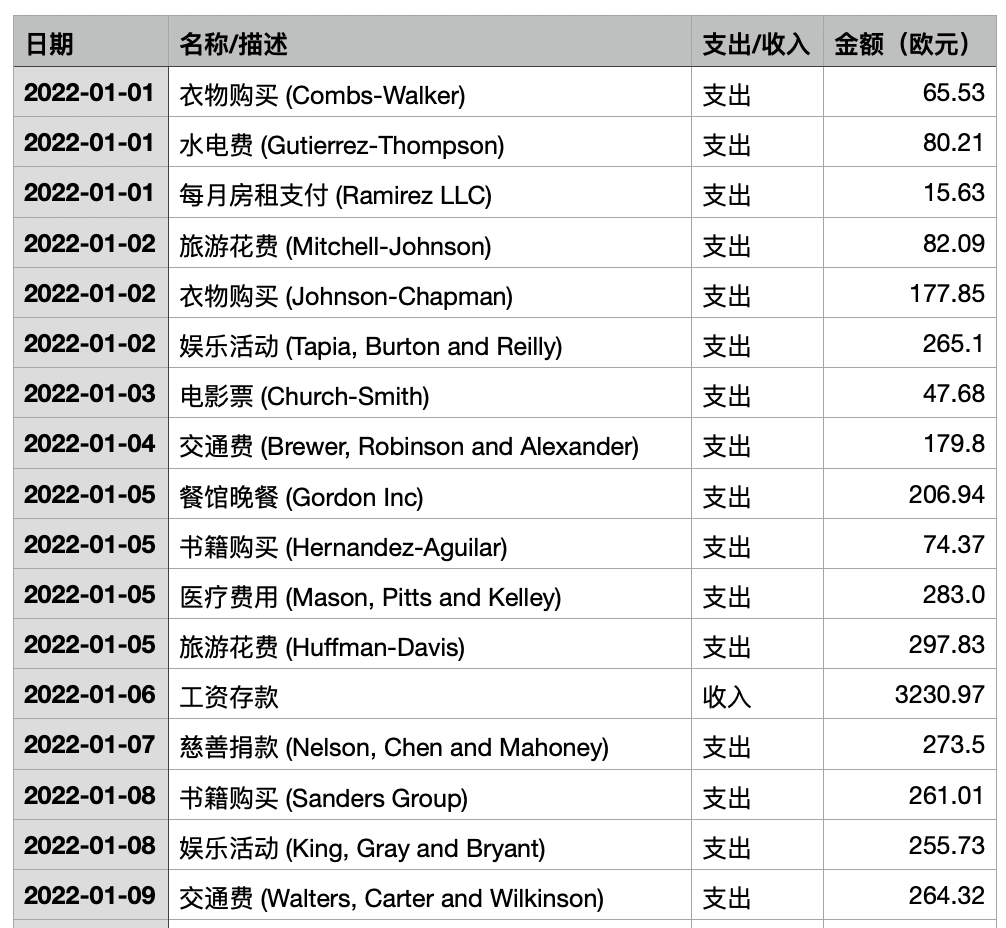
生成的财务数据示例
安装依赖项
接下来,我们需要安装LangChain和Streamlit的相关依赖项:
pip install langchain-community
pip install streamlit
Step 2:上传并处理数据
上传数据
创建一个新的Python文件“Upload.py”,并添加以下代码:
import streamlit as st
import pandas as pd
from langchain_community.llms import Ollama

# 初始化大模型
llm = Ollama(model="mistral")

# 定义分类类别
categories = [
    "Salary/Wages", "Investment Income", "Freelance Income", "Business Revenue",
    "Rental Income", "Housing", "Utilities", "Groceries", "Transportation",
    "Insurance", "Healthcare", "Entertainment", "Personal Care", "Education",
    "Savings/Investments", "Loans/Debt", "Taxes", "Childcare", "Gifts/Donations",
    "Dining Out", "Travel", "Shopping", "Subscriptions", "Pet Care",
    "Home Improvement", "Clothing", "Tech/Gadgets", "Fitness/Sports"
]
categories_string = ",".join(categories)
构建财务数据分类函数
- 分类财务数据
编写一个categorize_transactions函数,该函数接收财务数据名称,并使用提示工程技术引导大模型的输出,将财务数据分类到预定义的类别中。
def categorize_transactions(transaction_names, llm):
    prompt = f"""把以下费用分到适当的类别中。
    请记住,类别应从以下列表中选择一个,根据它们的主要目的或性质选择最相关的类别:{categories_string}。\n
    输出格式应始终为:transaction name - category。例如:Spotify #2 - Entertainment, Basic Fit Amsterdam Nld #3 - Fitness/Sports \n
    以下是待分类的交易:{transaction_names} \n"""

    print(prompt)
    filtered_response = []

    # 如果LLM输出不一致,重试
    while len(filtered_response) < 2:
        response = llm.invoke(prompt).split("\n")
        print(response)
        filtered_response = [item for item in response if '-' in item]
        print(filtered_response)

    # 将结果转换为DataFrame
    categories_df = pd.DataFrame({"Transaction vs category": filtered_response})
    size_dif = len(categories_df) - len(transaction_names.split(","))
    categories_df["Transaction"] = transaction_names.split(",") + [None] * size_dif
    categories_df["Category"] = categories_df["Transaction vs category"].str.split("-", expand=True)[1]

    return categories_df
- 创建数据处理函数
创建一个process_data函数,处理上传的数据文件,使用categorize_transactions对财务数据进行分类,并将分类后的数据合并到用于进一步分析的全局DataFrame中。
def hop(start, stop, step):
    for i in range(start, stop, step):
        yield i
    yield stop

def process_data(df: pd.DataFrame):
    unique_transactions = df["Name/Description"].unique()
    index_list = list(hop(0, len(unique_transactions), 30))

    # 初始化全局DataFrame
    categories_df_all = pd.DataFrame()

    # 批量处理交易数据
    for i in range(0, len(index_list) - 1):
        print(f"Looping: {i}")
        transaction_names = unique_transactions[index_list[i] : index_list[i + 1]]
        transaction_names = ",".join(transaction_names)

        categories_df = categorize_transactions(transaction_names, llm)
        categories_df_all = pd.concat([categories_df_all, categories_df], ignore_index=True)

    # 清理数据
    categories_df_all = categories_df_all.dropna()
    categories_df_all["Transaction"] = categories_df_all["Transaction"].str.replace(r"\d+\\.\s?", "", regex=True).str.strip()

    new_df = pd.merge(df, categories_df_all, left_on="Name/Description", right_on="Transaction", how="left")
    new_df.to_csv(f"data/{uploaded_file.name}_categorized.csv", index=False)

    return new_df
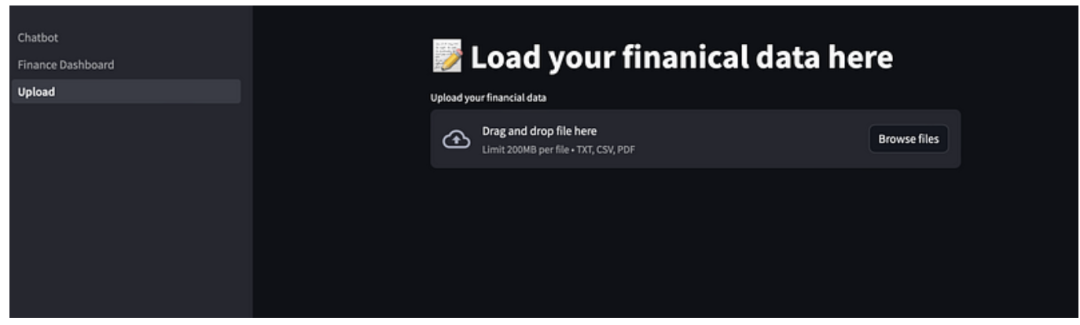
- 创建Streamlit Web应用程序
首先设置Web应用程序的标题,并添加一个文件上传小部件,让用户上传他们的财务数据。
st.title("📝 上传你的财务数据")
uploaded_file = st.file_uploader("上传你的财务数据", type=("txt", "csv", "pdf"))
- 处理上传的数据
文件上传后,读取到pandas DataFrame中,并调用process_data函数进行财务数据分类。
if uploaded_file:
    with st.spinner("正在处理数据..."):
        file_details = {"FileName": uploaded_file.name, "FileType": uploaded_file.type}
        df = pd.read_csv(uploaded_file)
        df = process_data(df)
        st.markdown("数据处理完成:OK")
- 运行Streamlit应用程序
运行Streamlit应用程序后,你将看到一个类似以下的界面:
Step 3:财务数据分析
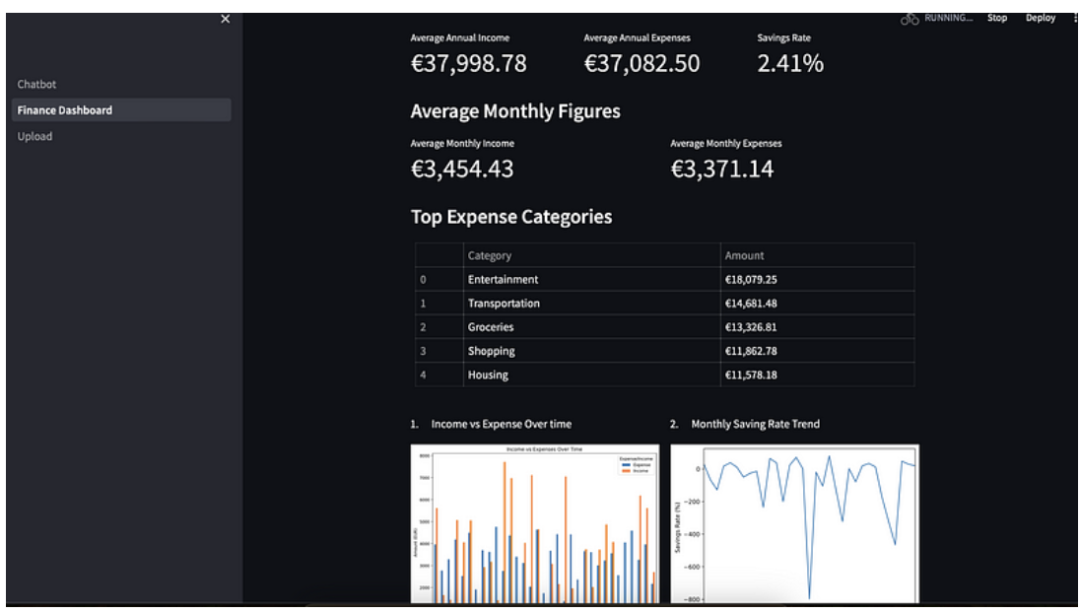
所有财务数据都已通过大模型Mistral分类后,你可以开始进行财务分析了,包括以下三个步骤:
- 定量分析:计算收入和支出,确定资金的主要流向。
- 可视化展示:绘制财务数据图表,发现趋势。
- 定性分析:将收集到的财务指标反馈给Mistral,通过提示词让大模型对你的财务状况进行定性分析。
定量分析
创建一个新的Python文件“Finance_Dashboard.py”,导入必要的Python库并初始化Ollama。
import os
import streamlit as st
import pandas as pd
import matplotlib.pyplot as plt
from langchain_community.llms import Ollama

llm_llava = Ollama(model="llava")
llm = Ollama(model="mistral")
然后,创建一个financial_analysis函数来分析财务数据。
def financial_analysis(data: pd.DataFrame):
    key_figures = {}

    yearly_income = data.loc[data['Expense/Income'] == 'Income'].groupby('Year')['Amount(EUR)'].sum().mean()
    yearly_expenses = data.loc[data['Expense/Income'] == 'Expense'].groupby('Year')['Amount(EUR)'].sum().mean()

    top_expenses = data.loc[data['Expense/Income'] == 'Expense'].groupby('Category')['Amount(EUR)'].sum().sort_values(ascending=False)

    monthly_income = data.loc[data['Expense/Income'] == 'Income'].groupby(data['Date'].dt.to_period('M'))['Amount(EUR)'].sum().mean()
    monthly_expenses = data.loc[data['Expense/Income'] == 'Expense'].groupby(data['Date'].dt.to_period('M'))['Amount(EUR)'].sum().mean()

    savings = yearly_income - yearly_expenses
    savings_rate = (savings / yearly_income) * 100 if yearly_income > 0 else 0

    key_figures['Average Annual Income'] = f"€{yearly_income:,.2f}"
    key_figures['Average Annual Expenses'] = f"€{yearly_expenses:,.2f}"
    key_figures['Annual Savings Rate'] = f"{savings_rate:.2f}%"
    key_figures['Top Expense Categories'] = {category: f"€{amount:,.2f}" for category, amount in top_expenses.head().items()}
    key_figures['Average Monthly Income'] = f"€{monthly_income:,.2f}"
    key_figures['Average Monthly Expenses'] = f"€{monthly_expenses:,.2f}"

    return key_figures
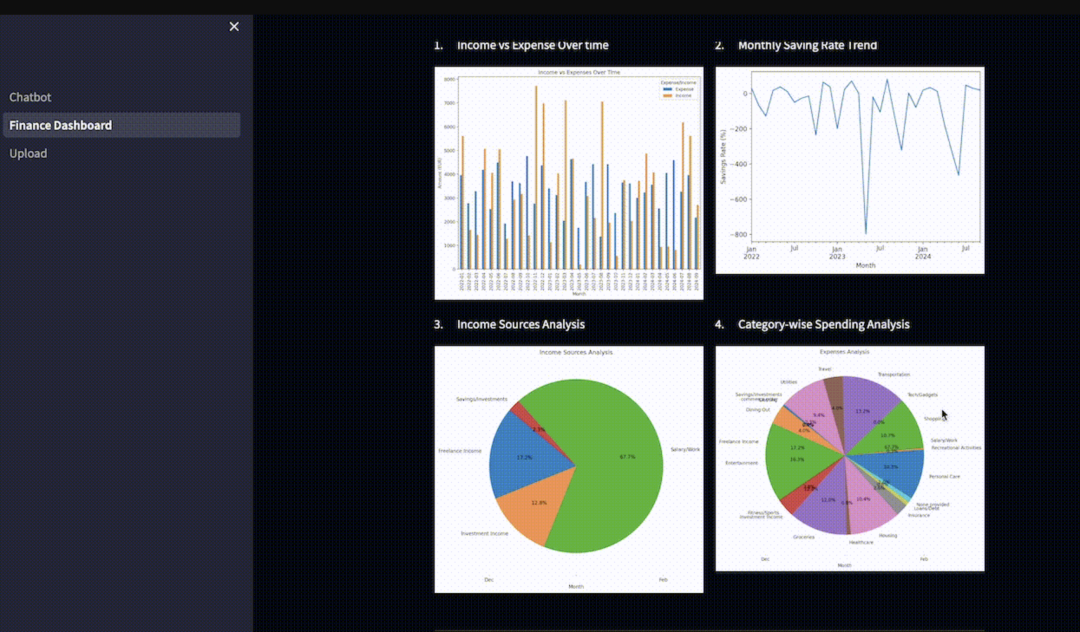
可视化展示
我们将可视化财务数据,包括收入与支出随时间变化图、每月存款、收入来源图、支出类别分析等。
def plot_income_vs_expense_over_time(df):
    st.markdown("1. 收入与支出随时间变化")
    income_expense_summary = df.groupby(["YearMonth", "Expense/Income"])["Amount(EUR)"].sum().unstack().fillna(0)
    income_expense_summary.plot(kind="bar", figsize=(10, 8))
    plt.title("收入与支出随时间变化")
    plt.ylabel("金额(欧元)")
    plt.xlabel("月份")
    plt.savefig("data/income_vs_expense_over_time.png", bbox_inches="tight")
    st.pyplot(plt)

def plot_saving_rate_trend(data: pd.DataFrame):
    st.markdown("2. 每月储蓄率趋势")
    monthly_data = data.groupby(['YearMonth', 'Expense/Income'])['Amount(EUR)'].sum().unstack().fillna(0)
    monthly_data['Savings Rate'] = (monthly_data['Income'] - monthly_data['Expense']) / monthly_data['Income'] * 100
    fig, ax = plt.subplots()
    monthly_data['Savings Rate'].plot(ax=ax)
    ax.set_xlabel('月份')
    ax.set_ylabel('储蓄率 (%)')
    plt.savefig("data/saving_rate_over_time.png", bbox_inches="tight")
    st.pyplot(fig)

def plot_income_source_analysis(data: pd.DataFrame):
    st.markdown("3. 收入来源分析")
    income_sources = data[data['Expense/Income'] == 'Income'].groupby('Category')['Amount(EUR)'].sum()
    income_sources.plot(kind="pie", figsize=(10, 8), autopct="%1.1f%%", startangle=140)
    plt.title("收入来源分析")
    plt.ylabel("")  # 隐藏y轴标签
    plt.savefig("data/income_source_analysis.png", bbox_inches="tight")
    st.pyplot(plt)

def plot_category_wise_spending_analysis(data: pd.DataFrame):
    st.markdown("4. 各类别支出分析")
    expenses_by_category = data[data['Expense/Income'] == 'Expense'].groupby('Category')['Amount(EUR)'].sum()
    expenses_by_category.plot(kind="pie", figsize=(10, 8), autopct="%1.1f%%", startangle=140)
    plt.title("支出类别分析")
    plt.ylabel("")  # 隐藏y轴标签
    plt.savefig("data/expense_category_analysis.png", bbox_inches="tight")
    st.pyplot(plt)
加载财务数据:
total_df = pd.DataFrame()
for root, dirs, files in os.walk("data"):
    for file in files:
        if file.endswith(".csv"):
            df = pd.read_csv(os.path.join(root, file))
            total_df = pd.concat([total_df, df], ignore_index=True)
total_df["Date"] = pd.to_datetime(total_df["Date"])
total_df["YearMonth"] = total_df["Date"].dt.to_period("M")
total_df["Year"] = total_df["Date"].dt.year
设置Streamlit仪表盘:
st.title("我的本地AI财务助手")

st.markdown("**一个个性化且安全的财务数据分析工具,提供量身定制的建议和见解。**")

analysis_results = financial_analysis(total_df)

# 显示年度数据
st.subheader("年度数据")
col1, col2, col3 = st.columns(3)
col1.metric(label="平均年度收入", value=analysis_results['Average Annual Income'])
col2.metric(label="平均年度支出", value=analysis_results['Average Annual Expenses'])
col3.metric(label="年度储蓄率", value=analysis_results['Annual Savings Rate'])

# 显示月度数据
st.subheader("月度数据")
col1, col2 = st.columns(2)
col1.metric(label="平均月度收入", value=analysis_results['Average Monthly Income'])
col2.metric(label="平均月度支出", value=analysis_results['Average Monthly Expenses'])

# 显示主要支出类别
st.subheader("主要支出类别")
expenses_df = pd.DataFrame(list(analysis_results['Top Expense Categories'].items()), columns=['类别', '金额'])
st.table(expenses_df)

# 显示图表
with st.container():
    col1, col2 = st.columns(2)
    with col1:
        plot_income_vs_expense_over_time(total_df)
    with col2:
        plot_saving_rate_trend(total_df)

with st.container():
    col3, col4 = st.columns(2)
    with col3:
        plot_income_source_analysis(total_df)
    with col4:
        plot_category_wise_spending_analysis(total_df)
运行Streamlit时,你将看到一个类似以下的仪表盘:
Step 4:提供财务建议
最后,我们将之前生成的定量和定性分析结果提供给Mistral,生成个性化的财务建议。
with st.container():
    col3, col4 = st.columns(2)
    with col3:
        plot_income_source_analysis(total_df)
    with col4:
        plot_category_wise_spending_analysis(total_df)

with st.spinner("生成报告中..."):
    total_response = ""
    for root, dirs, files in os.walk("data"):
        for file in files:
            if file.endswith(".png"):
                response = llm_llava.invoke(f"作为一名专业财务规划师,分析图像:{os.path.join(root, file)}。请提供从图像中提取的见解和关键数据。")
                total_response += response
    total_response += f"\n以下是用户的关键财务数据:{results_str}"

st.write("---------------")
st.markdown("**财务分析与预算规划**")

summary = llm.invoke(f"你是一位有帮助且专业的财务规划师。根据以下分析:{total_response},总结用户的财务状况,并提供节省开支的建议。突出用户可以减少开支的类别,并根据他们的收入和目标建议一个理想的储蓄率。使用友好的语气。")
st.write(summary)

st.write("---------------")
st.markdown("**投资建议**")

if "user_answers_str" in st.session_state:
    user_investment_answer = st.session_state.user_answers_str
else:
    user_investment_answer = ""

investment_tips = llm.invoke(f"你是一位有帮助且专业的财务规划师。根据用户的风险承受能力和投资目标,提供适合的投资选项概述。讨论股票、债券、共同基金、ETF和其他符合其个人档案的投资工具的基础知识。解释多样化的重要性以及风险管理在投资中的作用。")
st.write(investment_tips)
通过Streamlit创建的仪表盘可以帮助你更好地了解财务状况,并生成个性化的投资建议。
结语
通过本教程,你已经学会了如何构建一个本地AI驱动的财务洞察工具,从而更好地了解你的财务状况。这个项目的亮点在于:你的财务数据始终安全地保存在你的电脑上。
希望你喜欢这个项目!如果你发现了更好的方法来分类财务数据,请在评论中告诉我!
关注作者:Yanli Liu
本文需要一定的编程基础。已参加过AI线下工作坊二期的同学,可以使用我们提供的方法,操作更流畅。
了解课程👉常见问题解答